Spread Calculator: how to price spot, futures and funding trades before you enter
In short
- The calculator has three tabs: Spot-Spot for a cross-exchange trade, Futures for a Long and Short pair, and Funding for funding rate arbitrage.
- It subtracts exchange fees and funding from the spread and shows the net profit or loss in dollars.
- It only calculates what you enter. Account for slippage, withdrawal fees and price moves separately.
The Spread Calculator works out what is left of an arbitrage trade after fees and funding. You enter prices, the number of coins and exchange fees, and it shows the spread, total fees and net profit. That tells you before trading whether a spread from the table covers its costs. The calculator is on the Spread Calculator page and works without signing in.
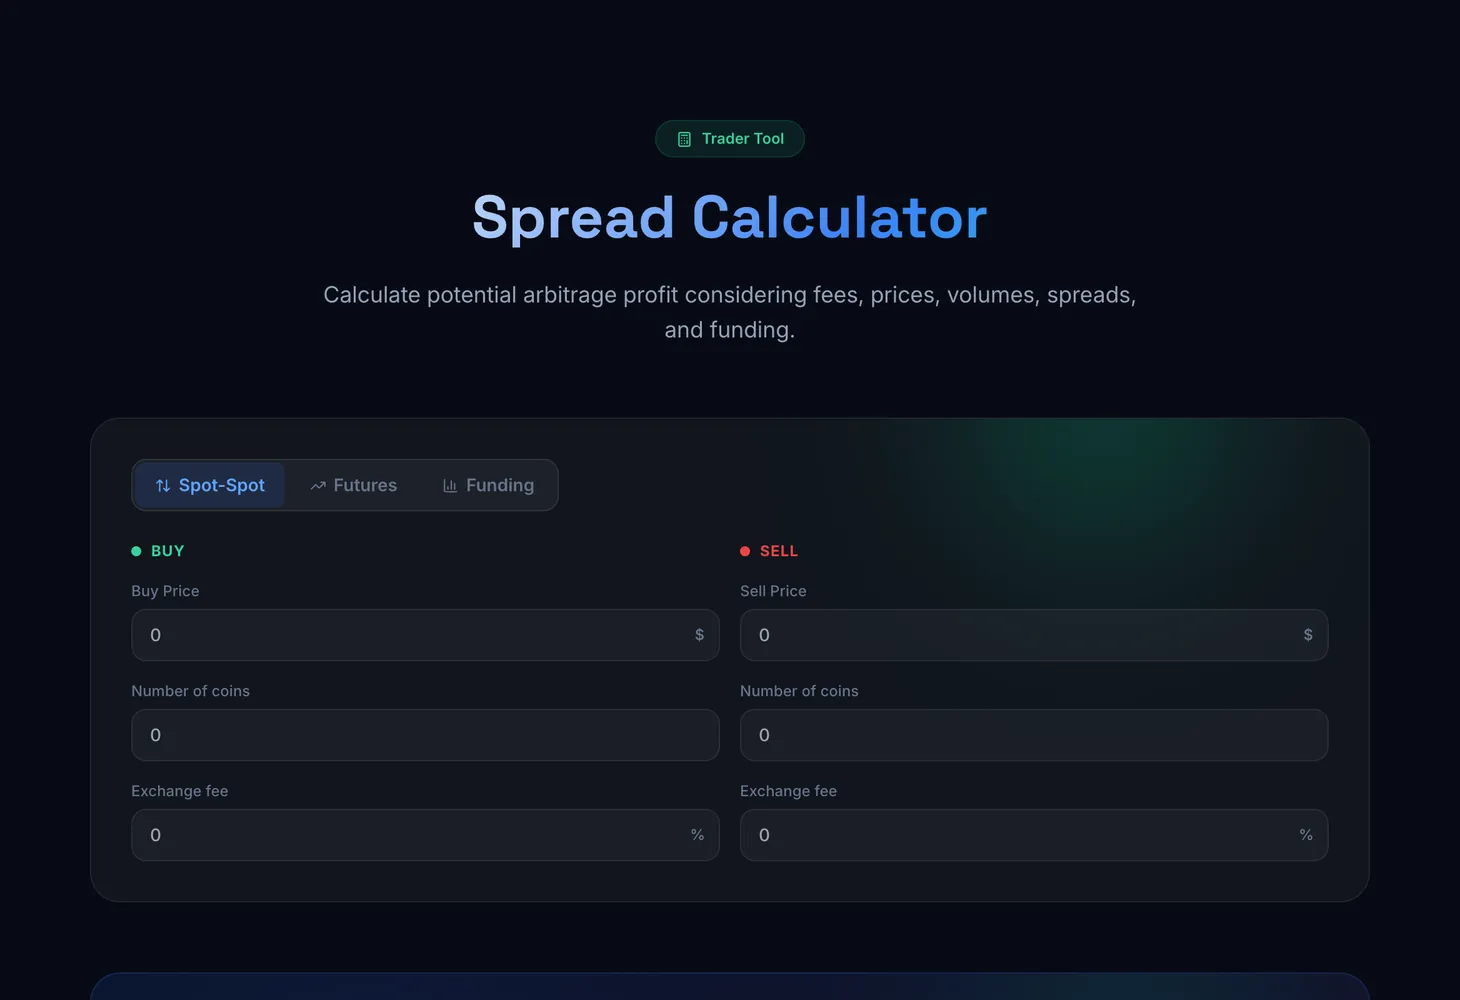
Calculator tabs
| Tab | For which trade |
|---|---|
| Spot-Spot | Buy a coin on one exchange and sell it on another |
| Futures | Open a Long on one exchange and a Short on another, then close both |
| Funding | Hold a Long and a Short on different exchanges and collect the funding rate difference |
The values you enter are saved in your browser, so you do not have to type them again next time.
The Spot-Spot tab
The Buy block is on the left, the Sell block on the right. Each has three fields:
- Buy Price or Sell Price — the coin's price on the exchange, in dollars.
- Number of coins — how many coins you buy or sell.
- Exchange fee — the trading fee in percent.
The Result block shows the Spread in percent, the Net Profit in dollars and the Total Cost of the purchase.
The Futures tab
Two columns, Long and Short, with the same fields: Open price, Number of coins, Close price, Exchange fee, Funding rate in percent, and Accrual time and Position time in hours.
The result shows the opening and closing amounts and PnL Long and PnL Short for each side. Below are Total Fees, Spread and Net Profit for the whole pair.
The Funding tab
The fields match the Futures tab. The result is different: Funding Spread, Funding Income, PnL Long and PnL Short, Total Fees and Net Profit. This shows how much the funding payments bring over the position time and whether price moves and fees eat them up.
How to price a trade
Take prices from the table
Find a pair in a scanner, for example Spot – Spot. Use the Ask on the buying exchange and the Bid on the selling exchange, not the last price.
Choose a tab
Spot-Spot for moving a coin between exchanges, Futures for a pair of positions, Funding for a rate difference.
Enter the size and fees
Enter how many coins the trade covers and the fees on both exchanges. For market orders use the taker fee — see maker and taker.
Check the net profit
Compare Net Profit with the spread. If almost nothing is left after fees, the pair is not worth the transfer and the risk.
Example on the Spot-Spot tab
The numbers are illustrative. Say you can buy a coin at $100 and sell it at $102, the trade is 10 coins and each exchange charges 0.1%.
| Item | Calculation | Result |
|---|---|---|
| Buy | 10 × $100 | $1,000 |
| Sell | 10 × $102 | $1,020 |
| Spread | (102 − 100) / 100 | 2% |
| Fees | 0.1% of $1,000 and 0.1% of $1,020 | about $2 |
| Left | about $18 |
The withdrawal fee and slippage, which the calculator does not know, still come out of those roughly $18.
For how a funding rate trade works, read the Funding Arbitrage guide and the glossary entry on the funding rate.
Questions and answers
Do I need a plan for the calculator?
No. The Spread Calculator is open to everyone, no sign-in required.
Why is net profit lower than the spread?
Buy and sell fees come out of the price difference, and in futures and funding trades so do funding payments. The lower the spread, the larger the share fees take.
Does the calculator include withdrawal fees?
No. It counts trading fees and funding. Subtract the coin and network withdrawal fees and slippage from the result yourself.
Where do I get the funding rate?
The rate and payment period are shown in the Funding Arbitrage table and on the exchange's contract page.