Prediction market analytics: how to read the screen
In short
- The screen shows open interest, volumes and price moves across five prediction markets, plus a catalog of every market.
- The Strong moves, Where large money goes and Settling soon blocks point to where opportunities may be.
- Sports markets also carry the odds of 10 sportsbooks: the Odds ×N tag in the catalog and the Odds and Match surebets blocks on the market page.
- A price move or a lopsided flow of large bets is a reason to check a market, not a ready trading decision.
The Analytics screen shows where the money is on prediction markets right now: open interest, volumes and price moves across five platforms, large bets by market, upcoming settlements, new markets and platform health, including 10 sportsbooks. Use it to find a market, compare platform prices and spot a move before it reaches the others. You will find it under Analytics.
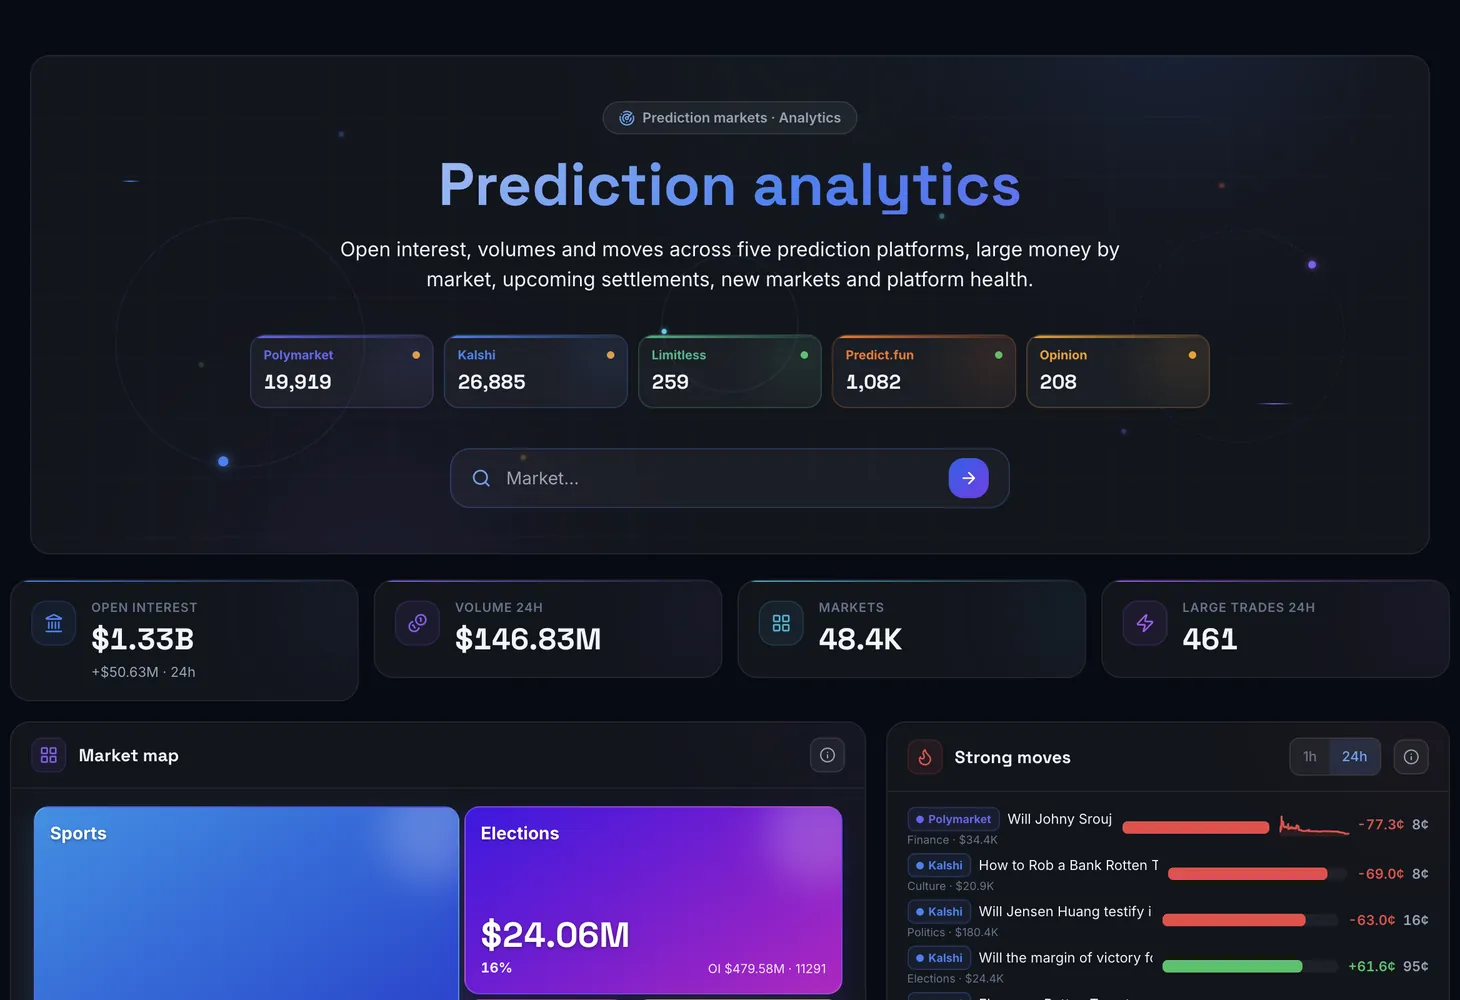
How the screen is organized
Four figures sit at the top: Open interest, Volume 24h, Markets and Large trades 24h. Below them are seven blocks.
| Block | What it shows |
|---|---|
| Market map | Squares by market category. A square's area is the day's trading volume; inside are open interest and the number of markets. A click on a category filters the catalog below |
| Strong moves | Liquid markets with the largest price change over an hour or a day. The bar shows the size of the change, with the price and the day's price chart next to it |
| Where large money goes | The mass of large taker trades of $1,000 and more by market: NO bets to the left, YES bets to the right. Periods: hour, day and week |
| Settling soon | Markets with open interest of $50,000 and more that settle within the next 72 hours. The shrinking bar is the time left, and the scale is the current YES price |
| New markets | Markets created in the last 24 hours, by trading volume. The creation time is exact, in UTC |
| Platforms | Each platform's state: for prediction markets, the number of markets, day volume, open interest and the last price update; for the 10 sportsbooks, the line and matches |
| All markets | A catalog of the five platforms' markets with prices, changes, volume, large-money flow, pairs and settlement date |
What Mass means
Mass is the imbalance of large bets toward one side. If noticeably more large money went into YES than into NO on a market, the bar extends to the right; if the opposite, to the left. Mass shows where large participants are betting, whatever the current price.
How to read the Platforms block
The coloured dot next to a platform tells you how fresh its prices are.
- Green and pulsing: prices arrive as a live stream.
- Yellow: prices arrive a few seconds late.
- Red: there is no connection. The time next to it shows when the last data came in. That platform's prices are stale, and arbitrage with it cannot be computed.
The same block lists 10 sportsbooks: Fonbet, Betcity, Olimpbet, Marathon, 5051X, Melbet, Winline, BC.Game, EGB and Dafa Sports. They have no volume or open interest. Instead you see the number of events in the line, how many of them are matched with prediction markets (in matches: N) and the line's state: line is updating or no connection.
Columns of the All markets catalog
| Column | What it shows |
|---|---|
| Market | The question the contract trades on |
| YES price | The current YES price with a scale |
| Δ 1h and Δ 24h | The price change over an hour and over a day |
| Volume 24h | The day's trading volume |
| Open interest | How much money currently sits in the market |
| Flow 24h | The day's large-money flow |
| Pair | Whether the question exists on other platforms and how far the prices are apart |
| Ends | When the market settles |
The Odds ×N tag on a sports market means the match is in the line of N sportsbooks. The tag's tooltip shows the fair YES probability from their odds, which you can compare with the YES price in the same row.
A click on a row opens the market page with every platform's prices, order books, holders and trades.
The market page: odds and surebets
A sports market page has an Odds block: a table of Platform · Odds on YES · Fair probability · Vs market price. Fair probability is the platform's odds with its margin removed, that is, the implied probability without the overround. Under the table are the median across all platforms and a scale showing the range of fair probabilities from lowest to highest.
Below it is the Match surebets block: the surebets for this match from the Sport mode of Prediction arbitrage. The Sport mode guide explains how to read them.
Filters and buttons
- Search markets: find a market by the text of the question.
- Category: keep one category. A click on a square of the market map does the same, and a second click clears the filter.
- Paired and Unpaired: show markets that do or do not have the same question on another platform.
- Periods: an hour or a day in Strong moves; an hour, a day or a week in Where large money goes.
If nothing fits your conditions, the catalog says "Nothing matches the filters".
What to look for
- A category jumped on the map: look there for moves and arbitrage.
- A strong move on one platform while the others are quiet: an arbitrage candidate. A move that comes with growing volume is more reliable than one without.
- A big mass imbalance with a flat price: the price has not caught up with the large money yet. An imbalance against the price move means large participants are betting against the crowd.
- A price near 50 cents hours before settlement: the market is undecided and swings will be sharp. A price of 95 cents and above means the outcome is almost decided and the yield is low.
- A Δ gap of 2¢ or more on a paired market: platform prices have diverged, so check the market in arbitrage.
- A YES price far from the fair probability implied by the odds: open the market page and look at the Match surebets block.
- A new market with big volume: watch for the same question appearing on other platforms. In the first hours the price gap tends to be at its widest.
How to use it
Take in the picture from the top
Look at the figures at the top and the market map to see which category is trading the most right now.
Find a move
In Strong moves pick a period, an hour or a day, and note the markets where the price moved the most.
Compare with the large money
In Where large money goes, check whether the mass imbalance agrees with the price move.
Filter the catalog
Pick a category, turn on Paired and look for markets where platform prices are apart. In sports, look for the Odds ×N tag.
Open the market page
Click the row: on the market page compare the platforms' prices, order books, holders and recent trades, and for a sports market the sportsbook odds. If the gap holds up, move on to arbitrage.
Plans
If the screen asks you to sign in instead of showing data, sign in. If a block says it is available on the Lite and Pro plans, the See plans button takes you to Pricing.
Related guides: Prediction arbitrage, the Sport mode and Smart Money. The theory is in the course on prediction market arbitrage, and the terms are in the glossary: open interest, order book, maker and taker, decimal odds.
Questions and answers
What is open interest on a prediction market?
It is the amount of money currently sitting in the market's open contracts. Large open interest before settlement means a lot of money is waiting for the result.
What does Mass mean in the large-money block?
The imbalance of large trades toward YES or NO over the chosen period. A bar to the right means more large bets on YES; to the left, on NO.
What does a red dot next to a platform mean?
There is no connection to the platform and its prices are stale. The time next to the dot shows when the last data arrived. Arbitrage with that platform cannot be computed until the connection is back. For sportsbooks the same state reads no connection.
What does the Odds ×N tag in the catalog mean?
The match behind this market is in the line of N sportsbooks. Their odds, with the margin removed, give a fair YES probability: if it differs noticeably from the YES price, check the Match surebets block on the market page.
How do I find markets where platform prices have diverged?
In the All markets catalog turn on Paired and look at the Δ gap between platforms. A gap of 2¢ or more is a reason to open the market page and check the pair in arbitrage.