How to use the DEX Overview in Genesis OnChain
In short
- The DEX Overview is a feed of large swaps on decentralized exchanges with their estimated price impact.
- The Impact column shows the expected price move, and Fact 5m shows what really happened.
- Clicking a token on the map or in the lists keeps only its trades in the table and opens its chart.
The DEX Overview is a live feed of large swaps on decentralized exchanges. For every trade you can see who bought or sold, on which chain and venue, what share of the pool's liquidity it took, what price move was expected and what actually happened. Open it from the menu: Genesis OnChain → DEX Overview.
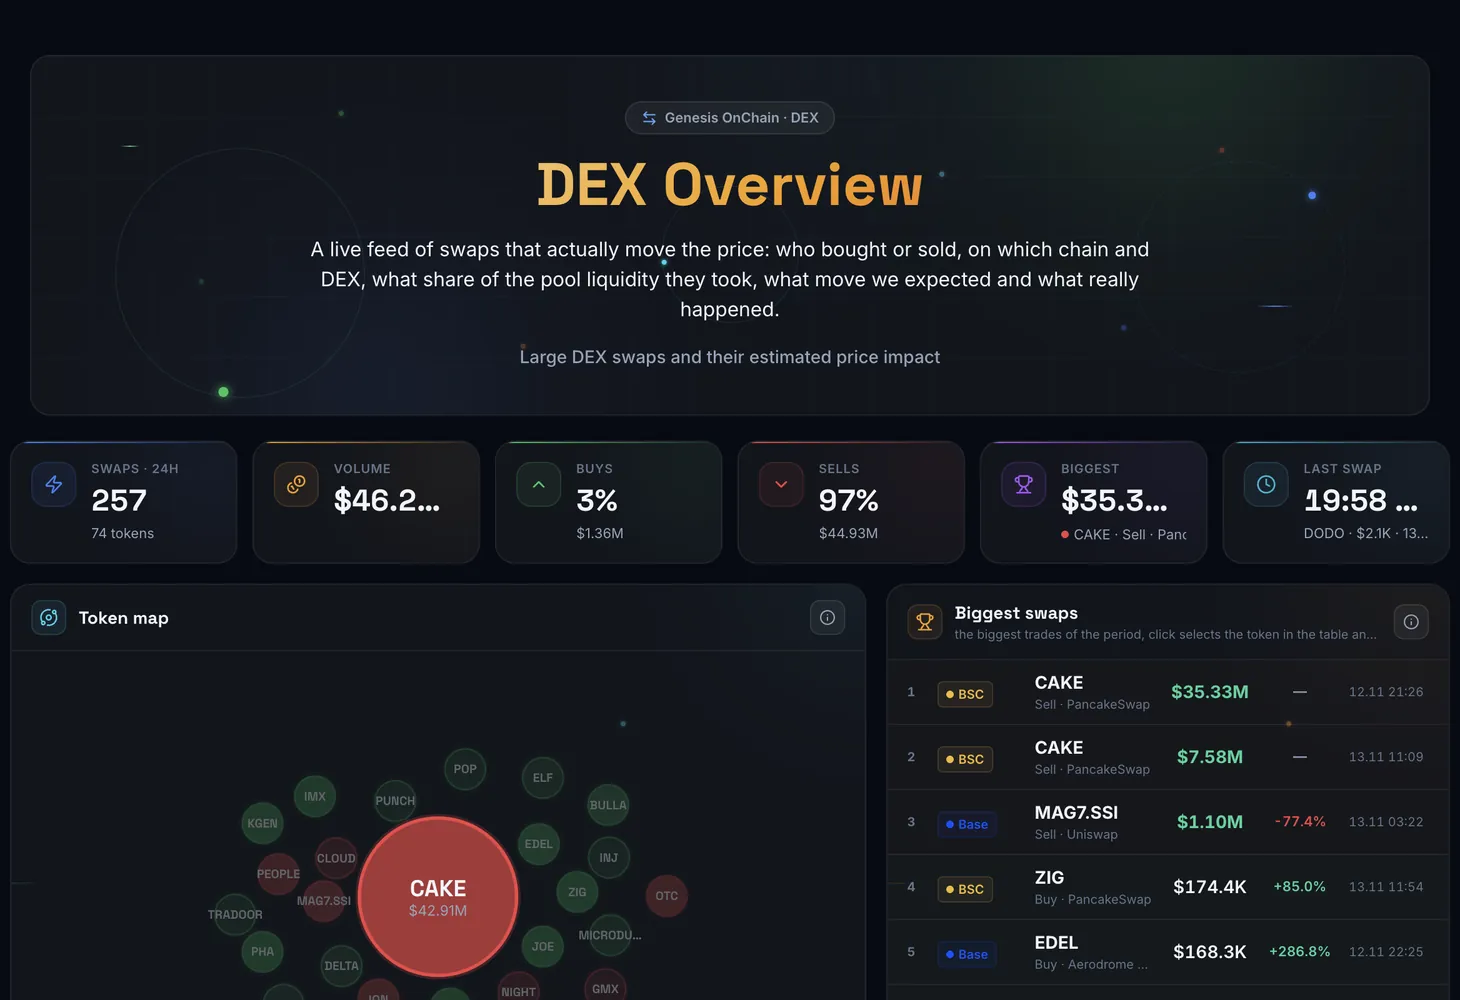
How the screen is organized
Cards with the totals of the period sit at the top: Swaps, Volume, Buys, Sells, Biggest and Last swap. Below are blocks with charts and lists, and the Swaps table comes last.
| Block | What it shows |
|---|---|
| Token map | Each circle is a token. Its size is the dollar volume of trades, its colour shows what prevails, buys (green) or sells (red), and its intensity shows how strong the imbalance is |
| Token chart | The price of the selected token from its DEX pool candles or exchange candles. Trades from the table are marked with circles: green below for buys, red above for sells |
| Token pressure | Buys minus sells per token over the period. A bar to the right means more buying, to the left more selling. Next to it is the DEX price move over 5 minutes and an hour |
| Biggest swaps | The biggest trades of the period: token, side, venue, the estimated price impact and the exact time |
| Most active tokens | The tokens with the most trades: buy/sell ratio, volume, hourly price move and the number of distinct wallets |
| Chains and DEXes | How the volume is split between chains (the ring) and venues (the bars) |
| Swaps | The table of all large trades of the period |
Columns of the Swaps table
| Column | What it shows |
|---|---|
| Chain | The blockchain where the trade happened |
| Time | When it happened |
| Token | What was bought or sold |
| Side | Buy or Sell |
| Amount | The trade size in dollars |
| DEX · path | The venue and the swap path |
| Pool liq. | The pool's liquidity, which shows what share of the pool the trade took |
| Impact | The estimate of how far the trade will move the price |
| Fact 5m | What really happened to the price 5 minutes later |
| Links | Links to the explorer, Arkham and DexScreener |
Every row expands. Inside you will find Amount, Trade price, Change over 5 min and Change over 1 hour, Price after 30 s and Price after 5 min, Pool, Swap path, Trader, Transaction, Contract and Fact status. Addresses can be copied, and the Coin page link opens the coin page.
Periods, filters and clicks
- Period: 15m, 1h, 6h, 24h or 7d. All blocks and the table are recalculated for it.
- Search: the "Token, address, tx…" field searches by ticker, address and transaction.
- Chain: trades on one chain.
- Side: buys only or sells only.
- With fact: only swaps whose real price move 5 minutes later is already known.
- Clicking a token on the map, in Token pressure or in the lists keeps only its trades in the table and shows its chart.
- Clicking a chain or a venue in Chains and DEXes keeps only their trades in the table. A second click clears the filter.
- Source: the candle source selector on the token chart.
- Show more loads more table rows, and Fullscreen expands a block.
How to read the signals
- A trade of 30–50% of pool liquidity will move the price noticeably.
- Several buys of one token in a row mean someone is building a position.
- A long green pressure bar with a weak price rise means the buying is not priced in yet. A long red bar is a sell-off.
- Many trades from many wallets mean broad interest. Many trades from one or two wallets mean a single player and possible manipulation.
- A big buy with no rise on the chart means it is being sold into and the market is weak.
How to use the DEX Overview
Choose the period
15m shows what is happening right now, while 24h and 7d give the bigger picture.
Find tokens with an imbalance
Look for big bright circles on the token map and long bars in Token pressure. These are the tokens being actively bought or sold right now.
Select a token
Click its circle or row. The table keeps only that token's trades, and the chart shows its candles with the trades marked.
Expand a swap row
Check the trade price, the pool, the swap path and the trader's address. The links open the transaction in the explorer.
Compare the estimate with the fact
Turn on the With fact filter and compare Impact with Fact 5m. This shows whether large trades really move the price of this token.
Other on-chain events, such as transfers, exchange deposits and unlocks, are on the Genesis OnChain dashboard and in Analytics. The glossary entry on DEX explains how decentralized exchanges work, and the course lesson What DEX arbitrage is shows how trades are built on the price gap between DEXes and exchanges.
Questions and answers
What does the Fact 5m column show?
The real change of the token's price 5 minutes after the trade. Compare it with the Impact column to see whether the estimate matched what happened.
What do "waiting for fact", "collecting fact" and "fact unavailable" mean?
The first two statuses mean the real price move for the trade is not ready yet. "Fact unavailable" means it could not be determined for this trade. The With fact filter keeps only trades with a ready value.
How do I see the trades of one token only?
Click its circle on the token map or its row in the lists. You can also type the ticker or the address into the search field.
How is Token pressure different from the Swaps table?
The table shows individual trades. Token pressure adds up all buys and subtracts all sells of a token over the period, so you see the overall imbalance without the noise of single trades.