How to use Genesis OnChain Analytics
In short
- Analytics turns all on-chain events of the last 24 hours or 7 days into numbers and shows how the price reacted.
- The main table is Coins in focus, with events, net flow to exchanges, DEX buying and the price reaction per coin.
- Inflow to exchanges means possible sell pressure and outflow means accumulation, but confirm it across several blocks.
Genesis OnChain Analytics turns on-chain events into numbers: how much money went to exchanges and came back, what team wallets and perp DEX whales did, which unlocks are coming and which protocols were hacked. Most importantly, it shows how the price reacted to each event type. Open it from the menu: Genesis OnChain → Analytics.
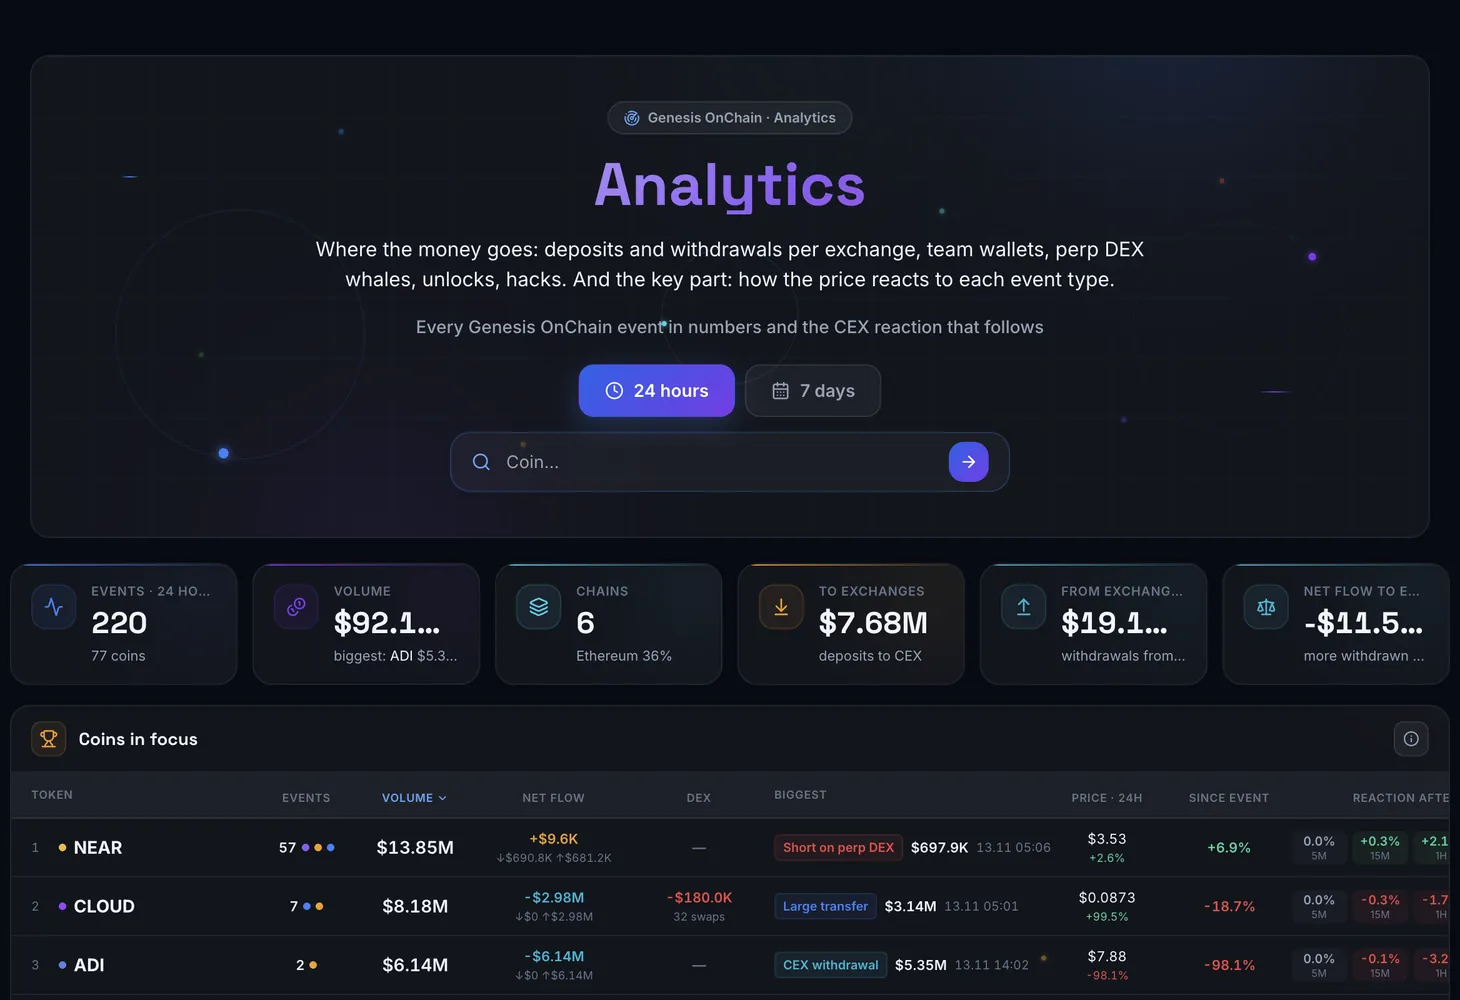
How the screen is organized
Cards with the totals of the period sit at the top, followed by blocks with tables and charts.
| Block | What it shows |
|---|---|
| Cards at the top | Events, Volume with the biggest event, the number of chains, To exchanges, From exchanges and Net flow to exchanges |
| Coins in focus | The coins with the most on-chain events over the period and the price reaction to them |
| Inflow and outflow by hour | How much was deposited to exchanges and withdrawn in each hour: orange bars up are inflow, cyan bars down are outflow |
| Exchanges: inflow and outflow | Per exchange: the inflow, the outflow, the net flow and the most active coin |
| Who → whom | The transfer map: senders on the left, receivers on the right. Orange lines go to exchanges, cyan lines come from them |
| Shares | Volume shares by event type: large transfers, exchange deposits, perp positions, claims, team transfers, bridges and mints |
| Team wallets | Transfers from project team and fund wallets and what part of that money went to exchanges |
| Perp DEX whales | Large positions on HyperLiquid, AsterDEX and Lighter: longs and shorts by platform, mass long − short per coin and the largest positions |
| Unlocks | The unlock calendar for the next 30 days and past unlocks with the price move in the 24 hours before and after |
| Claims and bridges | Claims by token and moves between networks through bridges and mints |
| Hacks | The protocol, the loss, the networks, the vulnerability type and the returned funds |
The Net flow to exchanges card is deposits minus withdrawals. A hint under the number reads "more deposited than withdrawn: sell pressure" or "more withdrawn than deposited: accumulation".
Columns of the Coins in focus table
This is the main table of the screen. It answers two questions: where the important things are happening right now and whether the price has reacted yet.
| Column | What it shows |
|---|---|
| Token | The coin and the event types seen for it |
| Events | The number of on-chain events over the period |
| Volume | The dollar value of those events |
| Net flow | Deposits to exchanges minus withdrawals from them |
| DEX | Buys minus sells on DEX |
| Biggest | The biggest event of the coin |
| Price · 24h | The price and its 24-hour move |
| since event | The price move since the biggest event |
| Reaction after the event | The price move 5 minutes, 15 minutes, 1, 4 and 24 hours after it |
The reaction is shown only for horizons that have already passed. If the biggest event happened an hour ago, there are no 4-hour and 24-hour values yet.
Period, search and actions inside blocks
- 24 hours and 7 days: the period all blocks are calculated for.
- Coin…: search by coin.
- Clicking an exchange in Exchanges: inflow and outflow expands its latest transfers.
- The Who → whom map: the circle size is the money through a participant, the line width is the sum of transfers between the pair. Hovering highlights a participant's transfers, and a click opens the address in the explorer.
- More and Less: expand long lists and bring back the short view.
- Block help explains what the block shows, why it matters and which signals to look for.
From a coin in the table you can go to its own coin page with a chart and an event timeline.
How to read the signals
- A large inflow to exchanges with a flat price means selling risk ahead. A large outflow means accumulation.
- Several hours of inflow in a row mean supply is piling up on exchanges. A sharp single bar is one large deal, worth finding on the Who → whom map.
- A team transfer to an exchange is a possible sale. A transfer between team wallets with no exchange is redistribution, not a sale.
- Shorts dominating a coin together with exchange inflows are a coordinated bet on a drop. In the whales block, the letter f next to a coin is 8-hour funding.
- A drop a day before an unlock means the market prices the sale in advance. A rise after the unlock means the supply was absorbed.
How to use Analytics
Choose the period
24 hours shows what is happening now, 7 days gives the picture of the week.
Look at the net flow to exchanges
The card at the top tells you at once which side prevails, deposits or withdrawals. Inflow and outflow by hour shows whether the flow came in waves or as a one-off.
Find the coins in focus
In the main table, look for coins with a large net flow and a weak price reaction: the market may not have priced the event in yet.
Check who is behind the flow
Exchanges: inflow and outflow shows which venue the coin is going to, Who → whom shows who exactly is moving it, and Team wallets shows whether it is the team.
Compare with perp DEX and unlocks
See which way the whales are positioned and whether an unlock is coming. When several blocks point the same way, the signal is more reliable.
The events themselves are shown as feeds on the Genesis OnChain dashboard, and large trades on decentralized exchanges are in the DEX Overview. The terms used in the blocks are in the glossary: open interest, perpetual futures, liquidity. For the risks of sharp moves, see the course lesson on the traps of pumps and dumps.
Questions and answers
What is the net flow to exchanges?
It is deposits to exchanges minus withdrawals from them over the period. When more is deposited than withdrawn, sell pressure grows. When more is withdrawn, coins are leaving for storage, which is a sign of accumulation.
Why are some values missing in Reaction after the event?
The reaction is shown only for horizons that have already passed. Until enough time has gone by since the event, there is no value.
What period does Analytics cover?
24 hours or 7 days; you switch the period at the top of the screen. The unlock calendar looks 30 days ahead.
How is Analytics different from the dashboard?
The dashboard shows individual events as real-time feeds. Analytics adds them up into totals per exchange, coin and type and adds the price reaction.