Coin page in Genesis OnChain: price, on-chain events and DEX swaps
In short
- The page gathers everything that happened to one coin over 7 days: on-chain events, DEX swaps and unlocks against its price.
- On the "Price and events" chart each event type has its own mark, and the "Event timeline" shows how the price answered it after 5 minutes, 1 hour and 24 hours.
- An event is a reason to look closer, not a ready signal: a past price reaction does not guarantee the same one next time.
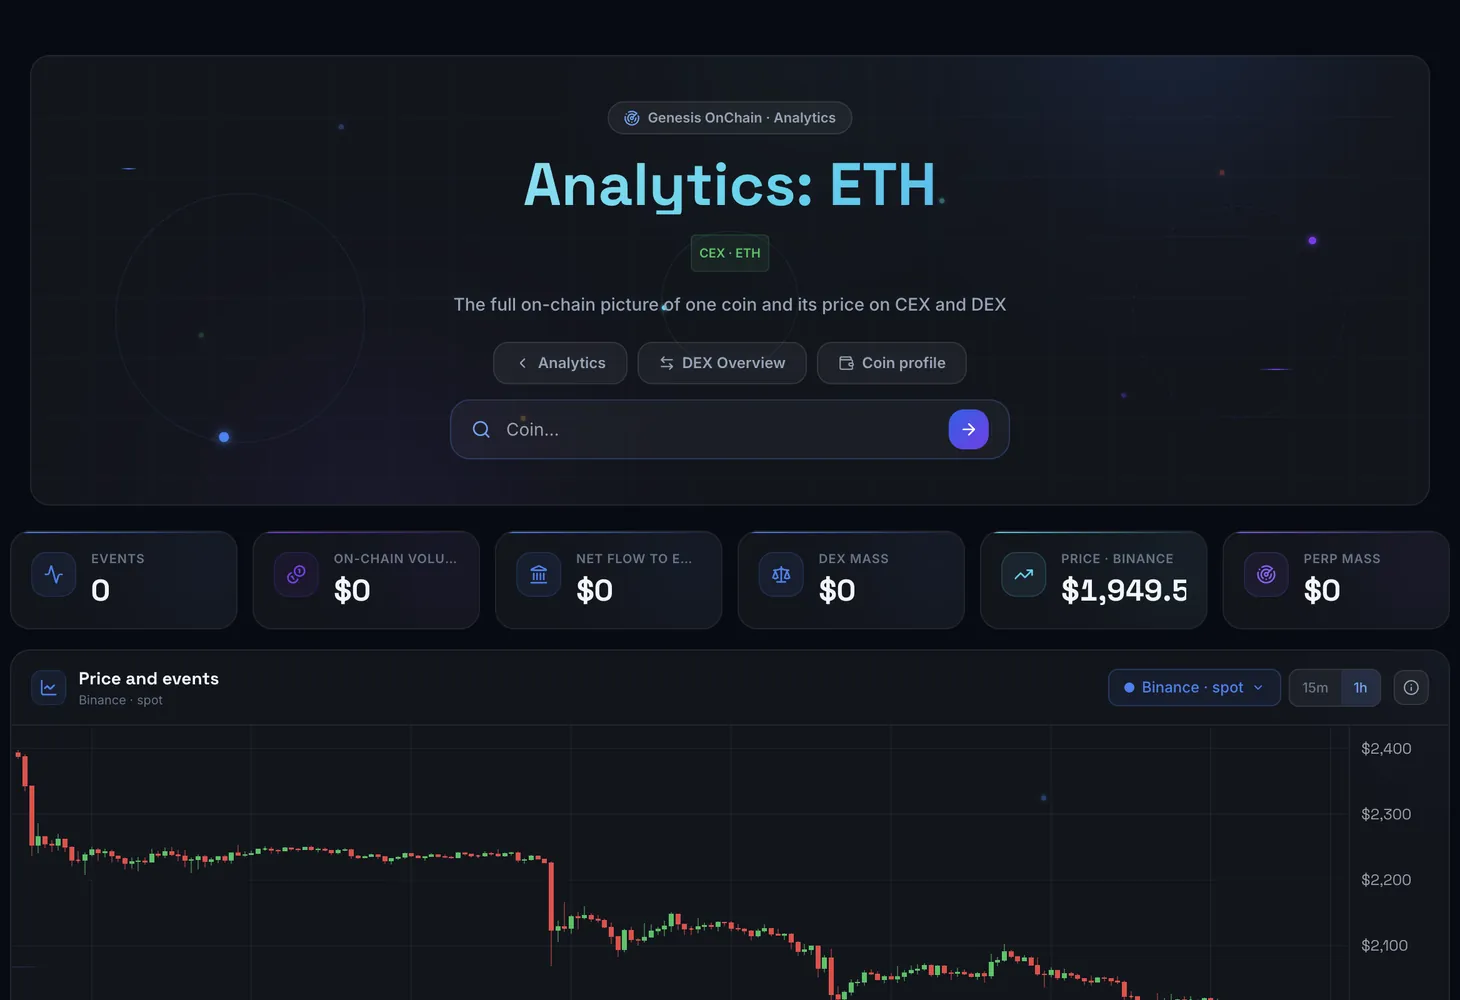
The coin page in Genesis OnChain shows the full on-chain picture of one coin over 7 days: transfers, exchange deposits and withdrawals, perp DEX positions, swaps and unlocks. All of it is laid over the coin's price on a CEX or DEX, so you can see what came before a price move and how the market answered each event.
How to open a coin page
- From Genesis OnChain Analytics: click a coin in the "Coins in focus" table.
- From the DEX Overview: expand a trade row and click the "Coin page" link.
- From the page itself: type a ticker into the "Coin…" field in the header to jump to another coin. The "Analytics" link takes you back to the section.
How the screen is laid out
| Block | What it shows |
|---|---|
| Header | Ticker, "Price", "Funding" and "Spread" of the coin on CEX |
| On-chain volume | Total of the coin's on-chain events in USD |
| DEX mass | Buys minus sells of the coin on DEX |
| Perp mass | Longs minus shorts on the coin on perp DEX |
| Price and events | Price candles with on-chain event and DEX trade marks |
| Event timeline | Every event over 7 days and the price reaction after each |
| DEX swaps | Large trades of the coin on decentralized exchanges |
If the coin does not trade on the supported CEX, the header says there is no price context. The price chart and reactions are not built in that case, but the on-chain data below stays.
The "Price and events" chart
The "Source" switch picks whose candles to show: an exchange or a DEX pool. By default, the source with the most data is selected.
| Mark | Event |
|---|---|
| →CEX and CEX→ | Exchange deposit and exchange withdrawal |
| →CEX× and CEX→× | A series of transfers to and from exchanges |
| team | Transfer from a team wallet |
| claim | Token claim |
| long and short | Perp DEX position |
| tx | Large transfer |
| bridge | Bridge transfer |
| hack | Hack |
Circles on the candles are DEX trades: green below are buys, red above are sells. The histogram under the chart is the inflow and outflow of the coin to exchanges per candle. Click a type in the legend to hide or show its marks.
What to look for:
- an exchange deposit before a drop — the sale was prepared in advance;
- a withdrawal from an exchange before a rise — the coin is being accumulated;
- a big DEX trade with no price reaction — the market absorbed it.
Event timeline
All on-chain events of the coin are collected in one feed: transfers, exchange deposits and withdrawals, perp DEX positions, claims, team transfers, bridges. For each event you see the price reaction after 5 minutes, 15 minutes, 1 hour, 4 hours and 24 hours; specifics are in the "Details" column.
A dot instead of a number means the horizon has not come yet or there is no candle for it. When one event type is followed by the same price move time after time, that is a pattern worth tracking. A large event with no reaction usually means the market has already priced it in.
DEX swaps
The block lists large trades over 7 days: side, amount, network, venue, the estimated price impact and the actual price move after 5 minutes. The button on the right opens all trades full-screen with search and filters.
When the fact is stronger than the estimate, liquidity is worse than it looks, and a large order will move the price more than expected. A run of buys on a rising price shows the trend is backed by money.
How to use it
Open a coin
Go to the page from Analytics or the DEX Overview, or type a ticker into the "Coin…" field.
Read the market background
Check price, funding and spread in the header, then "DEX mass" and "Perp mass": who outweighs whom, buyers or sellers.
Find events on the chart
Hide unneeded types in the legend and look at which marks come before noticeable price moves.
Check the pattern in the timeline
Compare the price reaction to events of the same type. A repeating market response is worth more than one striking case.
Terms from this page are in the glossary: funding rate and slippage. For a feed of events across all coins, see the Genesis OnChain Dashboard.
Questions and answers
Why is there no price chart on the coin page?
The coin was not found on the supported CEX and there are no candles for it among DEX pools. On-chain events and swaps are still shown.
What does a dot instead of a number in the timeline mean?
The reaction horizon has not come yet, for example the event happened less than an hour ago, or there is no candle for that time.
How is "DEX mass" different from "Perp mass"?
"DEX mass" is the difference between buys and sells of the coin on DEX. "Perp mass" is the difference between longs and shorts on the coin on perp DEX.