How to use the Genesis OnChain dashboard
In short
- The dashboard puts nine feeds of on-chain events on one screen, from large transfers to hacks.
- Every block has a help panel with What is this, Why track it, Key signals and Examples.
- An event is a reason to look closer at a coin, not a ready decision: one transfer proves nothing.
The Genesis OnChain dashboard shows on-chain activity in real time: large transfers, perp DEX positions, token unlocks and claims, mints and bridges, exchange deposits and withdrawals, team transfers and hacks. It helps you notice what large players do before it shows up in the price. In the menu it is Genesis OnChain → Dashboard.
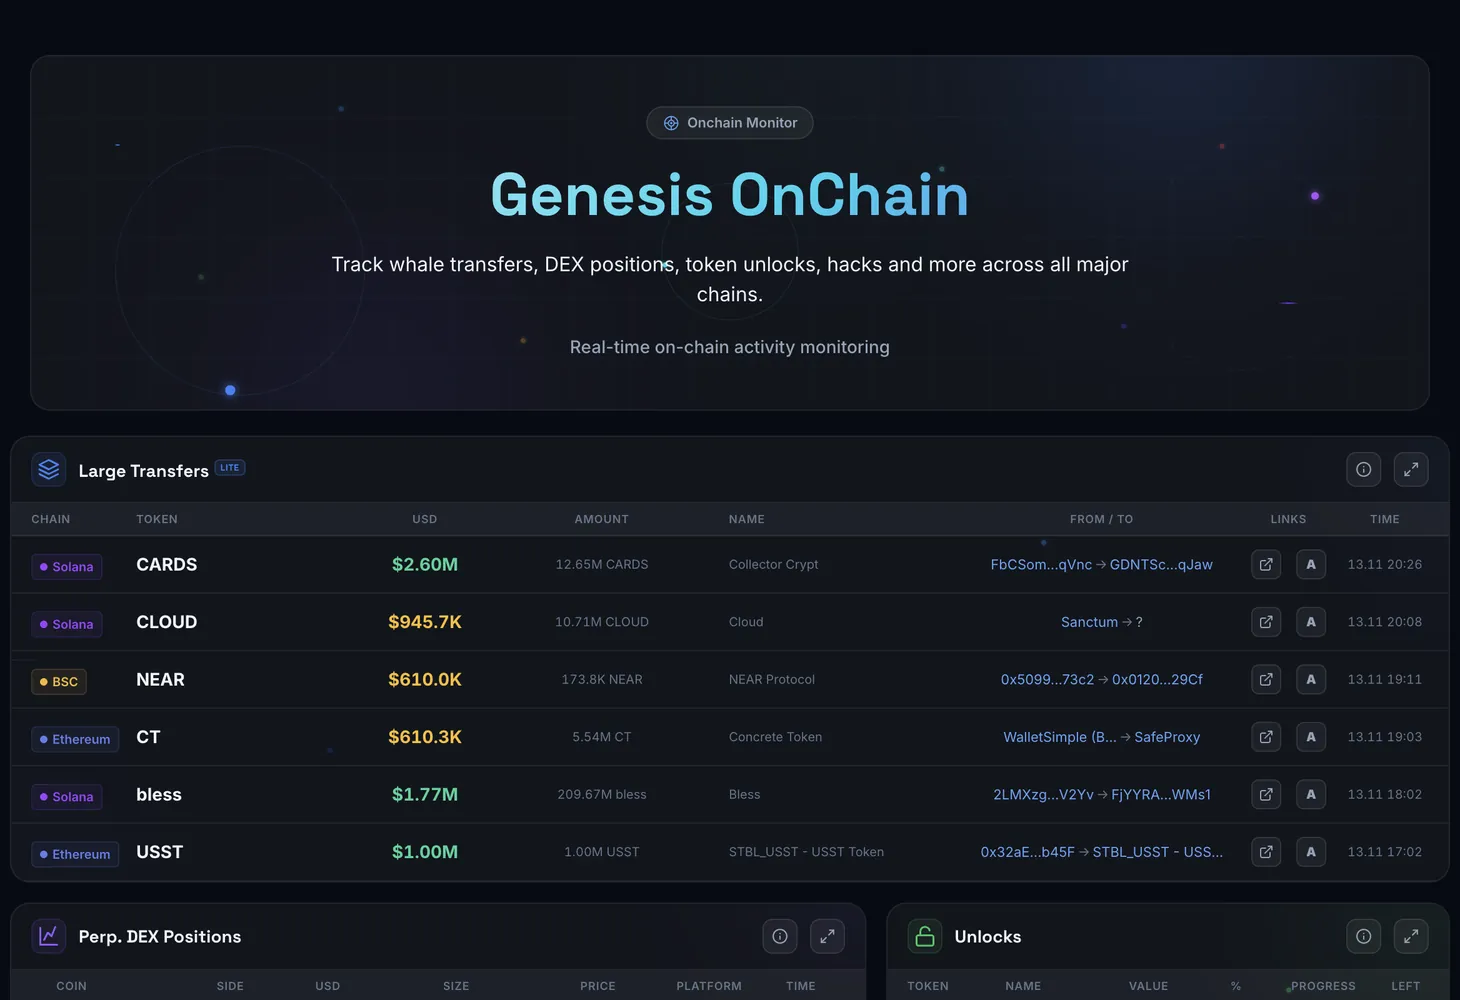
How the screen is organized
The screen is made of blocks. Each block is a separate feed of one event type. The block header shows how many events it holds, the biggest one and how many chains are involved.
| Block | What it shows |
|---|---|
| Large Transfers | Large token transfers between wallets on the major chains: Ethereum, BSC, Solana, Arbitrum and others |
| Perp. DEX Positions | Large longs and shorts being opened and closed on decentralized perpetual exchanges: HyperLiquid, GMX, dYdX and others |
| Unlocks | The schedule of token unlocks: which token, when, the dollar value and the percentage of market cap |
| Claims | Large claims of tokens from airdrops, vesting, staking rewards and yield farming |
| Coin Traffic | Many small transfers of one coin to one target within a short time, grouped into a single row |
| Mint / Bridge | Minting of new tokens, including the stablecoins USDT and USDC, and transfers between chains through bridges |
| CEX Deposits / Withdrawals | Large deposits to centralized exchanges and withdrawals from them: Binance, Coinbase, OKX, Bybit and others |
| Team Transfers | Activity of wallets that belong to project teams: foundations, treasuries and known founders |
| Hacks / Exploits | Hacks of DeFi protocols: the project, the damage, the affected chains, the attack type and the fund recovery status |
Columns in the blocks
The set of columns depends on the event type.
| Block | Columns |
|---|---|
| Large Transfers, CEX Deposits / Withdrawals, Mint / Bridge, Team Transfers, Claims | Chain, Token, USD, Amount, Name, From / To, Links, Time |
| Perp. DEX Positions | Coin, Side, USD, Size, Price, Platform, Time |
| Unlocks | Token, Name, Value, %, Progress, Left |
| Coin Traffic | Token, Direction, Target, Total, Txs, Window, Average, Largest, Time |
| Hacks / Exploits | Name, Chains, Amount, Date |
A few notes:
- From / To is the sender and the receiver of the transfer.
- Side is long or short.
- % in Unlocks is the unlock as a share of the token's market cap, and Left is the time remaining until the unlock.
- Direction in Coin Traffic is Deposit, Withdrawal or Transfer. Txs is the number of transfers in the group, Window is how long they took, Average and Largest are the average and the biggest transfer.
Smaller blocks hide some of the columns. You see the full set when a block is expanded to full screen.
Filters and buttons
- Help: a button in the block header. It opens four sections: What is this, Why track it, Key signals and Examples.
- Show all and Collapse: expand the whole feed of a block and bring back the short view.
- Full screen: a button in the header expands the block. In this view, filters appear above the feed.
- Search coin: keep the events of one coin.
- Network: keep the events of one chain. In Perp. DEX Positions this filter is Platform, and in Coin Traffic it is Direction.
- ≥$: the minimum event size.
- Time: period buttons; All removes the limit.
- Clear: resets the selected filter.
How to read the signals
The help panel of each block tells you what to look for. The most common patterns:
- A transfer to an exchange means possible sell pressure. A withdrawal from an exchange to a cold wallet means accumulation.
- A large long on a perp DEX means the trader expects growth, a large short means a drop. Mass liquidations cause sharp price moves.
- An unlock of more than 5% of market cap carries a high risk of price pressure.
- A large USDT or USDC mint is new capital coming in; stablecoin burning is capital leaving.
- Many small deposits of one coin to an exchange mean sell pressure is building.
- A hack of a protocol or a bridge is a risk for the token and for the chains it touched.
How to use the dashboard
Scan the block headers
Open Genesis OnChain → Dashboard. The event count and the biggest event show where most of the action is right now.
Read the block's help panel
If an event type is new to you, open the help panel: it explains what the data is, why it is worth tracking and which signals to look for.
Expand a block and set filters
Expand the block to full screen, find your coin with Search coin, then choose a chain and a minimum size.
Check the event against other blocks
One transfer is not enough. An exchange deposit weighs more when there is a team transfer from the same project or an unlock coming soon.
Check the price reaction
Totals for the same events and the price move after them are in Analytics, and the full picture of a single coin is on the coin page.
Plans
The dashboard blocks open with the Lite and Pro plans. A locked block is labeled "Available with Lite or Pro plan", and a block that needs the higher plan is labeled "Available with Pro plan only". See the Pricing page for what each plan includes.
Large trades on decentralized exchanges have their own screen, the DEX Overview. The basics of arbitrage and risk are covered in the course lessons What arbitrage is and why it works and risks and traps of pumps and dumps. For the terms, see the glossary: perpetual futures, open interest.
Questions and answers
How is the dashboard different from Genesis OnChain Analytics?
The dashboard is a set of live event feeds by type. Analytics sums the same events up over 24 hours or 7 days and shows how the price reacted to them.
What does the Coin Traffic block show?
Groups of small transfers of one coin to one target, such as an exchange. Each transfer alone goes unnoticed, but together they reveal coordinated action by several wallets.
Does an exchange deposit always mean a sale?
No. Coins are most often moved to an exchange to be sold, but it can also be collateral or a transfer between someone's own accounts. That is why an event should be checked against the price and the other blocks.
Why is there a lock on a block?
The block opens with a paid plan. The label on the block tells you which one: Lite or Pro.