Stock arbitrage: how to read the spread table for stocks, metals, indices and commodities
In short
- The table compares perpetual futures prices for stocks, metals, indices and commodities across crypto exchanges and shows the spread between them.
- Rows are grouped by asset: the best exchange pair comes first, other pairs expand below it.
- Fees, funding and slippage come out of the spread. The tool is available on the Pro plan.
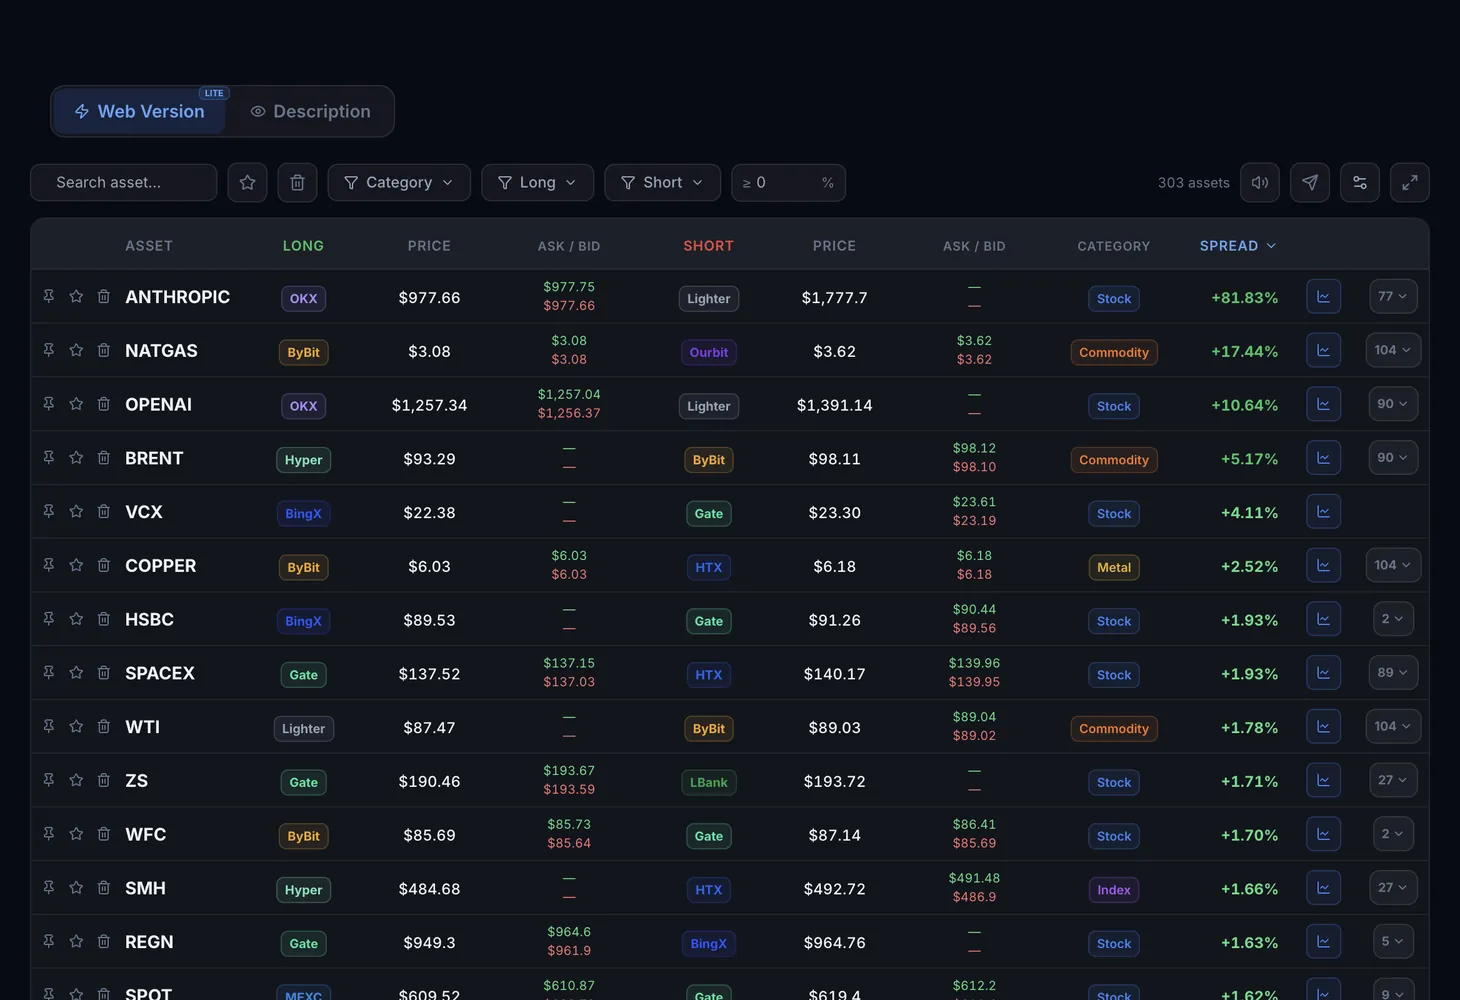
The Stock Arbitrage table shows price gaps between crypto exchanges for tokenized stocks, metals, indices and commodities. On CEX these assets trade as perpetual futures. If an asset is cheaper on one exchange than on another, you can go Long on the cheaper one and Short on the more expensive one. The table is on the Web version tab of Stock Arbitrage.
What assets the table covers
Assets fall into four categories, and each behaves differently: stocks react to company earnings and news, metals to macro events, commodities to supply and demand.
| Category | Example tickers |
|---|---|
| Stock | TSLA, AAPL, NVDA, COIN, MSTR |
| Metal | GOLD, SILVER |
| Index | SPX, NDQ |
| Commodity | WTI, GAS |
The price of such a contract is tied to the real asset but does not always match it. During high volatility or low liquidity it can drift temporarily, and that is when a spread between exchanges appears.
Table columns
| Column | What it shows |
|---|---|
| Actions | Pin, favorite and trash for the row |
| Asset | The asset's ticker |
| Category | Stock, Metal, Index or Commodity |
| Long exchange | The exchange where the asset is cheaper, where the long position is opened |
| Long price | The futures price on the Long exchange |
| Ask / Bid (Long) | Best selling and buying prices in the Long exchange's order book |
| Short exchange | The exchange where the asset is more expensive, where the short position is opened |
| Short price | The futures price on the Short exchange |
| Ask / Bid (Short) | Best selling and buying prices in the Short exchange's order book |
| Spread | The price difference between the exchanges in percent |
The spread is checked against the order book using the volume-weighted average price (VWAP) on real volume, not just the last price. From the table you can open the pair's chart in Genesis Charts.
In the Table settings window you can hide, show and drag columns. Actions can be hidden, but then there is nowhere to pin, favorite or trash rows.
Grouping, filters and buttons
- Grouping by asset — each asset shows its best exchange pair first, other combinations expand.
- Search asset — find a row by ticker.
- Long and Short exchange filters — keep only the exchanges you want on each side.
- Category — show only stocks, metals, indices or commodities.
- Spread — the minimum spread threshold.
- Sorting — by asset, spread, Long price and Short price.
- On the right are sound alerts for spreads above your threshold and fullscreen mode.
How to check a pair
Pick a category and a threshold
Set a category and a minimum spread to drop rows that will not cover fees.
Expand the asset
Compare the best pair with the others. If the spread exists only on one low-volume exchange, entering at your price will be hard.
Compare Ask and Bid
The Long opens at the Ask on the Long exchange, the Short at the Bid on the Short exchange. Calculate the spread between those two.
Account for funding
Compare the funding rates on both exchanges. The difference can eat the spread if you hold the position for a long time.
Calculate the result
Subtract opening and closing fees and slippage on the Futures tab of the spread calculator.
Plans
Stock Arbitrage is a Pro plan tool. Without a plan the page shows the tool overview and the Try PRO button. Plan details are on the Pricing page.
The theory is in the Stock arbitrage course, and how the contracts work is in the glossary entry on perpetual futures.
Questions and answers
What is stock arbitrage on a crypto exchange?
It is a trade on the price gap between tokenized futures on stocks, metals, indices or commodities on different exchanges. You go Long where the price is lower and Short where it is higher.
Do tokenized stocks track real prices?
Generally yes: they are perpetual futures indexed to real asset prices. During high volatility or low liquidity, temporary deviations can occur.
Why is the spread in the table larger than what a trade gets?
A trade fills at the Ask and Bid, not at the last price. Fees, the funding difference and slippage also come out of it.
Why is the tool Pro-only?
That is how the plans are set up: Pro unlocks all exchanges, all asset categories and the advanced stock arbitrage filters.