OI Tracking: an open interest table for exchange futures
In short
- The table shows open interest by coin and exchange and how it changed together with price over 5, 15 and 30 minutes and 1 hour.
- Reading price and OI together shows who is entering the market, longs or shorts, and whether a trend is backed by new money.
- Open interest is an analytical indicator, not a ready signal: an anomaly can mean a reversal or a continuation.
OI Tracking shows open interest on centralized exchange futures: how many positions are open in a coin and how that number moves together with the price. The table helps you see where capital is flowing, spot positions being built before a strong move and tell a steady trend from a liquidation cascade.
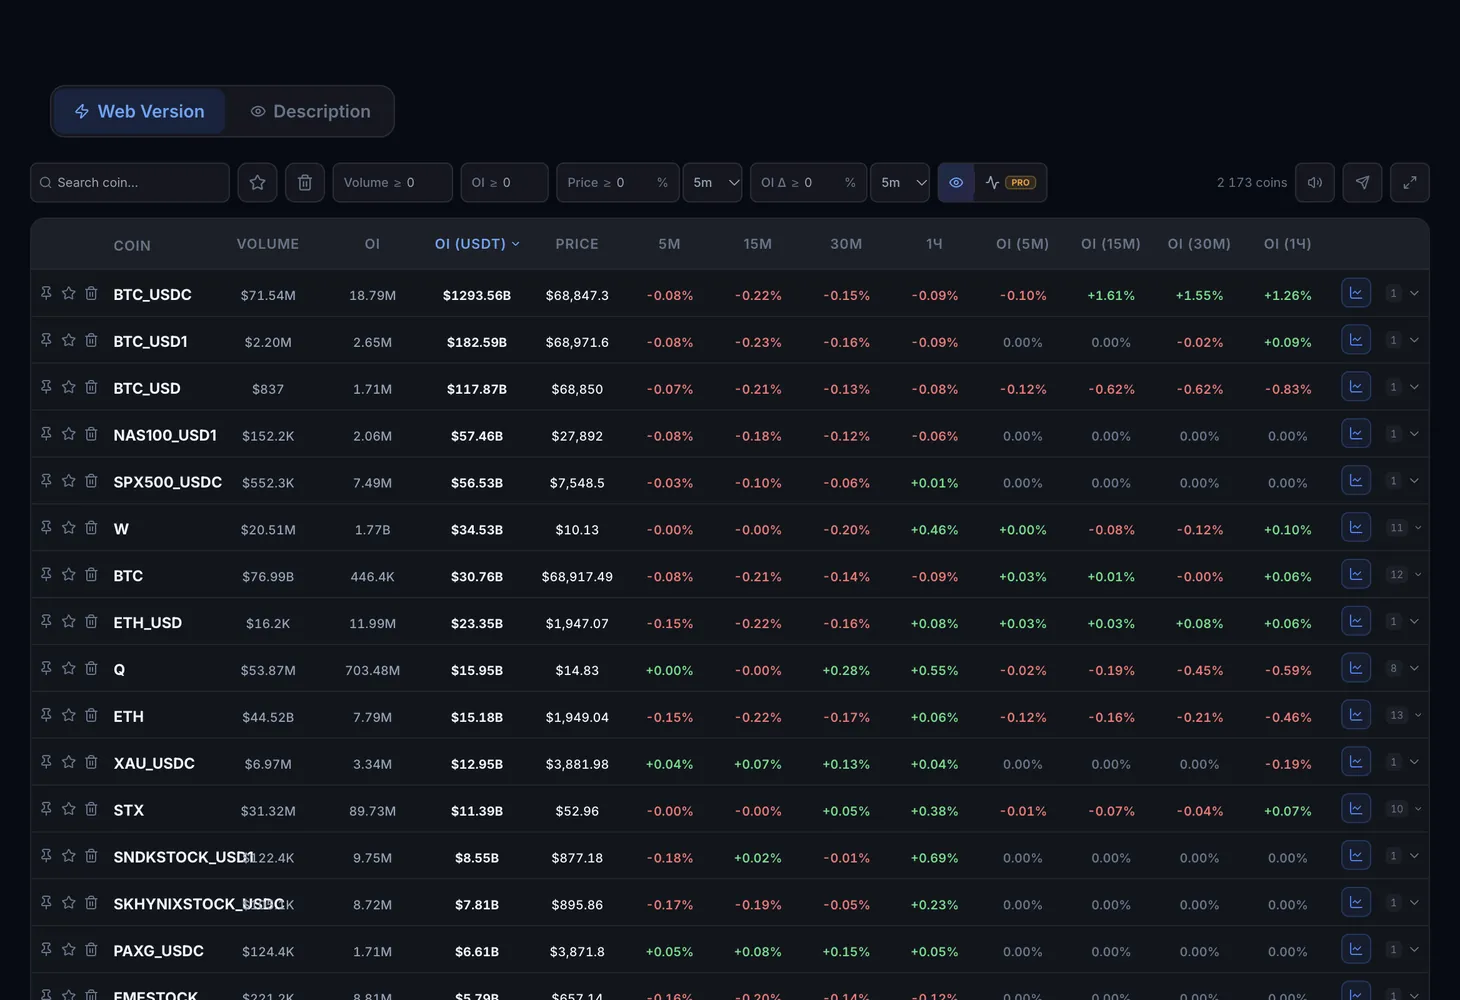
Table columns
| Column | What it shows |
|---|---|
| Coin | The coin's ticker, with favorite and trash buttons |
| Exchange | The futures exchange |
| Price | The contract's current price |
| Volume | Trading volume of the coin |
| OI (tokens) | Open interest in coins |
| OI (USDT) | Open interest in dollar terms |
| Price(5m), Price(15m), Price(30m), Price(1h) | Price change over the interval |
| OI(5m), OI(15m), OI(30m), OI(1h) | Open interest change over the same interval |
The Chart button in a row opens the OI chart, and the Open button takes you to the coin on the exchange.
Modes and filters
- General and Extended: the table modes. Extended gives the full picture for every coin and exchange, with filters and charts.
- Search coin: find a coin by ticker.
- All exchanges: choose exchanges. The Clear button removes the selection.
- Volume and OI: the minimum trading volume and the minimum open interest.
- Price and OI Δ: the minimum change in price and open interest, so only noticeable moves stay in the list.
- Favorites and Trash: coins you marked and coins you hid.
- Load more: add more rows.
How to read price together with OI
Open interest is the number of futures contracts that are still open. Volume shows how much was traded, OI shows how many positions remain open. That is why you look at both columns for the same interval.
| Price | OI | What it usually means |
|---|---|---|
| Rising | Rising | New positions are opening in the direction of the move, so the trend is backed by capital |
| Falling | Rising | Shorts are opening, or someone is building a position against the move |
| Rising | Falling | Large players are taking profit and the trend is losing strength |
| Sharp move | Sharp drop | A liquidation cascade: the market is force-closing positions |
After a liquidation cascade it is better not to enter during the washout itself: wait for OI to stabilize and only then look for an entry.
How to use it
Filter out small coins
Set a minimum Volume and OI so the table keeps only coins with noticeable activity.
Find anomalies
Enter the minimum change in the Price and OI Δ fields and sort the table by the column of the interval you need, for example OI(15m).
Compare price and OI
Check whether price and open interest move the same way and match it against the table above.
Check other exchanges
Find the same coin with the search. If OI is rising on several exchanges at once, the move is wider than one venue.
Open the chart
The Chart button shows how OI changed over time, and Open takes you to the exchange.
Plans
| What | Plan |
|---|---|
| General mode | No plan needed |
| Extended mode | Pro plan |
| OI charts | Pro plan |
Plan details are on the Pricing page.
How sharp moves relate to futures positions is covered in the Pumps and dumps course. The payment that longs and shorts exchange is explained in the funding rate entry.
Questions and answers
What is open interest?
The total number of futures contracts that have not been closed yet. Rising OI points to new capital coming in, falling OI means participants are closing positions.
How can I tell whether longs or shorts are entering?
Look at the OI change together with the price. Price and OI both rising usually means longs are opening. OI rising while price falls means shorts are opening. Falling OI means some traders are closing positions.
How do OI (tokens) and OI (USDT) differ?
The first shows open interest in coins, the second in dollar terms. The dollar figure is easier for comparing coins with each other.
What is available without a plan?
General mode. Extended mode and OI charts come with the Pro plan.