TradingView charts in Genesis Arbitrage: how to build and read a spread chart
In short
- A spread chart compares the price of one coin on two venues: the BUY side is where you buy, the SELL side is where you sell.
- The Price Lines, Spread, Spread Lines and Funding modes show one pair from different angles; intervals run from 5 seconds to one day.
- Spread history shows whether a price gap holds or flashes for a moment. It guarantees no profit: fees still come out of the spread.
TradingView charts in the Charts section show the price difference of one coin on two venues in real time. You pick a buy exchange and a sell exchange, and the chart draws the prices of both sides, the spread between them, or funding. This shows how long a price gap lasts and how often it appears.
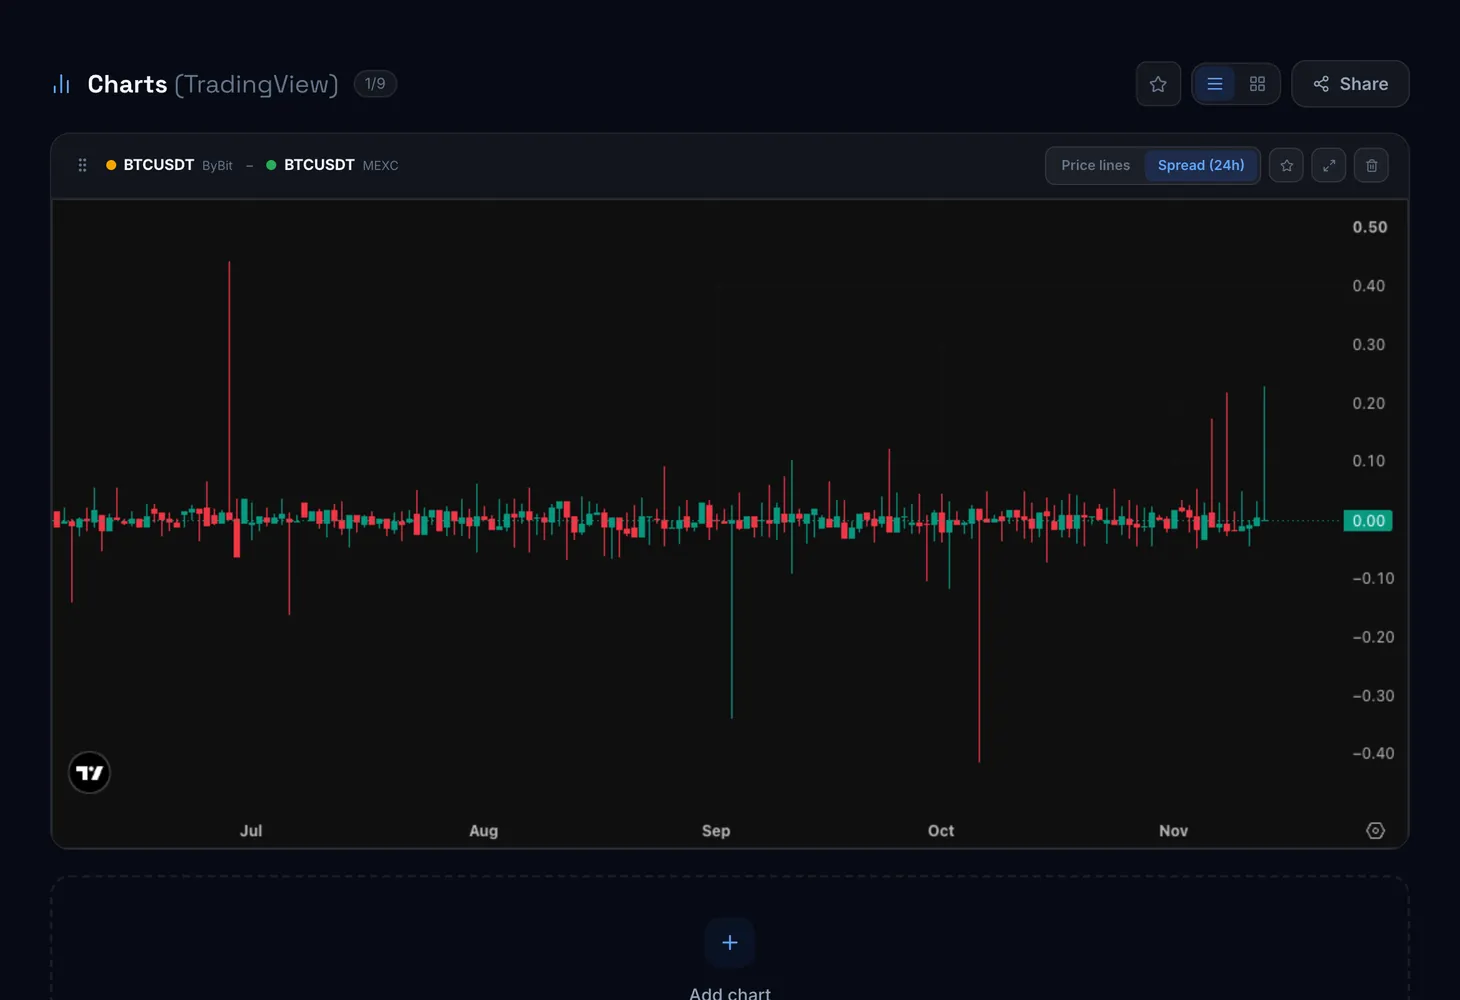
How the screen is laid out
Every chart is a pair of two sides. BUY is the venue where the coin is bought, SELL is where it is sold. A side is set by an exchange and a coin, or by a contract address on a DEX.
| Element | What it does |
|---|---|
| "Add spread chart" | Opens the BUY and SELL side picker for a new chart |
| "DEX contract" | A DEX side: paste the token's contract address; 200+ exchanges on 180 blockchains are available |
| "Enter symbol manually on" | Type a coin ticker if it is not in the selected exchange's list |
| "Build chart" | Creates a chart from the selected sides |
| Line above the chart | Current "Spread", "Spread (24h)", "Fund." and "Δ fund." |
Select the exchange first, then the coin: without an exchange the coin list will not open.
Modes and intervals
- Price Lines — prices of the BUY and SELL sides as two lines. You see which venue is more expensive.
- Spread — the price difference itself, in percent.
- Spread Lines — the same difference drawn as a line.
- Funding — funding rates of both sides. Useful for futures pairs.
Intervals: 5s, 1m, 15m, 1h, 1D. Short ones help catch the entry moment, long ones tell you whether such a gap is normal for the pair.
Chart buttons
- Swap BUY/SELL — switch the sides.
- Change coin/exchange — replace one side without deleting the chart.
- Fullscreen — expand the chart; press again to close fullscreen.
- Share — copy a link to the chart.
- Star — add the chart to favorites.
- Remove chart — take it off the screen.
How to use it
Add a chart
Click "Add first chart" or "Add spread chart".
Pick the sides
For BUY and SELL choose an exchange and a coin. For a DEX token, click "DEX contract" and paste the contract address.
Build it and choose a mode
Click "Build chart". Start with the Spread mode, then switch to Price Lines to see which side drives the gap.
Review the history
Set the interval to 1h or 1D and look at "Spread (24h)". A gap that holds for hours is more reliable than a one-off flash.
Save the pair
Star the chart to come back to it later.
Plans
Which charts a plan includes is marked on the Pricing page with the labels "TradingView", "Genesis Charts" and "TradingView + Genesis Charts". Order-book lines and order-book data are covered in the Genesis Charts guide.
How to read spread and depth is explained in the course lesson "Spread, depth, volume: how to read the table" and in the glossary entry "Spread".
Questions and answers
What do BUY and SELL mean on the chart?
BUY is the venue where the coin is bought, SELL is where it is sold. The spread shows how much higher the price is on the SELL side than on the BUY side.
Can I build a chart for a DEX token?
Yes. When picking a side, click "DEX contract" and paste the token's contract address.
Why does the coin list not open?
Select an exchange first. If the coin you need is not in the list, enter its symbol manually.